INTRODUCTION
For field exercise eight a partner and I were tasked with measuring and recording a distance azimuth survey. A distance azimuth survey is an older process of surveying where a reference point is used for the basis of the entire survey. Surveyors chose a reference point based on how easy it is to recognize from aerial imagery and measure a desired number of data points out from that reference point. Surveyors measure these data points by picking out objects or landmarks surrounding the reference point and measuring there distance an azimuth in relation to the reference point using a measuring tape and compass. My partner and I measured and recorded 100 data points. My partner and I did not, however, go as old school as using a tape measure and compass. Instead we used a true pulse 200 Range Finder which shoots out a laser to instantly measure both the distance an object is from the reference point and the azimuth of the object. The reason why my partner were instructed to utilize this method of surveying versus something more complex and high tech is that sometimes things may go wrong out in the field and older methods that use fewer technologies may be necessary to get the job done.
Study Area
My partner and I chose to conduct our survey in a grassy field just West of the UW-Eau Claire McIntyre Library. This area had a good central location in which to place the reference point as well as many surrounding landmarks/objects with which we could measure and record as data points. The image in figure one below shows the location on which we conducted our distance azimuth survey.
 |
| Figure 1: shows the lower UW-Eau Claire campus. Inside the red box is the field in which my partner and I conducted our distance azimuth survey.
|
METHODOLOGY
To get started my partner and I set up the TruPulse Range Finder on a tripod so that it was unable to move its position from start to finish. Then, using a downloaded phone app we took the coordinates of our reference point (middle of the TruPulse Range Finder tripod). collecting the reference points coordinates is not necessary if it's easily identifiable from aerial imagery. We then divided the surveying into two different jobs. Person number one was tasked with actually measuring the data points with the TruPulse. To use the TruPulse Range Finder all a surveyor has to do is turn it on (make sure it has enough battery), toggle between its different functions (two of them are distance in meters and azimuth in degrees), and press a button to shoot the laser at the object of interest. Below in figure two is an image of a TruPulse 200 Range Finder mounted on a tripod.
 |
| Figure 2: shows a TruPulse 200 Range Finder mounted on a tripod. |
Table 1: shows the distance azimuth data as an excel spread sheet. The object ID, Distance, Azimuth, Type, Latitude, and Longitude of each data point is given.
 |
The data is now ready to be imported into ArcMap. This is done by creating a geodatabase, right clicking it, and importing the data as a table (single). This process can be viewed in figure three below.
 |
| Figure 3: shows the pathway to importing the excel file into a geodatabase table. |
 |
| Figure 4: shows how to navigate to the Bearing Distance To Line tool - Data Management tools > Features > Bearing Distance To Line. |
 |
| Figure 5: shows the distance and bearing image. The reference point appears at the center of all the lines which are shooting out to the 100 data points collected for the exercise. |
After the Bearing Distance To Line tool is used the Feature Vertices to Points tool needs to be utilized in order to add points onto the ends of the lines. Figure six: below shows the pathway to the Feature Vertices to Points tool.
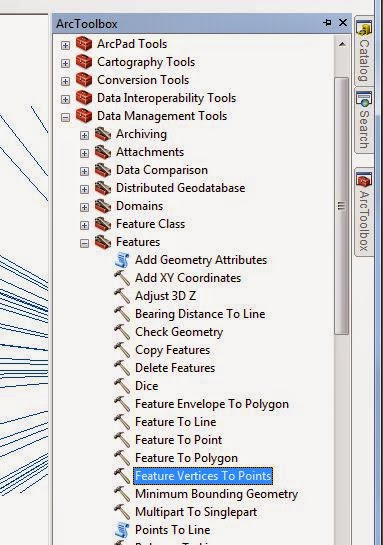 |
| Figure 6: shows the pathway to the Feature Vertices to Points tool - Data Management tools > Features > Feature Vertices to Points. |
 |
| Figure 7: shows the distance azimuth survey map along with aerial imagery. Each red line leaves the reference point according to it's azimuth and each line ends at a teal point according to it's distance. |
DISCUSSION
Figure seven above shows that the data collected by my partner and I was not completely accurate. Three points appear in the building to the northeast of the reference point, and six points appear in the building to the east of the reference point. There are two different theories I have hypothesized that could explain this error the first of which is a bad reference point. My partner and I chose to put our reference point in the middle of the field so that we could have 360 degrees with which to measure data points. In hind sight we should have picked the corner of a building so that we could pin point exactly where our reference point was by looking at aerial imagery. The other theory is that knocking over the tripod halfway through our data collection screwed things up. The wind was gusting up to twenty miles per hour on the day we conducted our survey and it knocked over the tripod at one point. My partner and I had difficulty finding the exact same spot we had set up the tripod so it may have been a few inches off.
Something I should mention when talking about conducting a survey is magnetic declination which is the angle between magnetic north and true north. Basically the direction a compass points to is magnetic north and the direction along the earth's surface towards the geographic North Pole is true north. The difference between the two is magnetic declination and in Eau Claire's case it is 1.36 degrees west. This means that every azimuth measured needs 1.36 degrees subtracted from it to be accurate. Magnetic Declination is an important concept to understand because it can cause a survey to be inaccurate if it is not accounted for. For my surveys purposes correcting for magnetic declination was not imperative, but if it was a survey being conducted for a high end firm I would have to account for this error.
Although my partner and I used a relatively new piece of technology (TruPulse 200 Range Finder) to measure both the distance and azimuth of the data points in relation to the reference point, the method is an old one and has been replaced with newer methods such as dynamic surveys, controlled networks surveys, and trilateration surveys. As stated above, there are times when an older method must be fallen back on because of technology failure or budget constraints. Having a backup method that is quick and cost effective is a great plan B.
CONCLUSION
Being aware of the different types of errors that can occur was the most important part of this field exercise. There was nothing My partner and I could have done about the wind blowing our tripod over, but we definitely should have had the foresight to pick a better reference point. At the very least we were able to overcome the magnetic declination difference between magnetic north and true north. This exercise marked the first time that groups conducted their surveys without collusion with other groups or the instructor. For me it was a defining moment in my geospatial technologies world.
No comments:
Post a Comment